Data:
Country: UK
Period: Yearly data from 2010 to 2022.
Cause of Death Data
The data used in this analysis is the number of deaths that occurred in England and Wales between 2010 and
2022, by underlying cause code (ICD-10), sex, and age group (up to 90+). The source is the UK Office for
National Statistics (ONS). The direct links to the mortality data by cause for 2010 to 2021 and 2022 are listed
below:
Link to the ONS 2022 data source:
Death occurrences by sex, five year age group and underlying cause (ICD-10 code) England and Wales: 2022
Link to the ONS 2010-2021 data source:
Death occurrences by sex, five year age group and underlying cause (ICD-10 code) England and Wales: 2010-2021
UK Monthly Registered Deaths (All cause)
Deaths registered monthly in England and Wales
Information regarding ONS cause of death statistics:
-
When analysing the ONS data for cause of death we noticed that there are discrepancies between the number
of deaths which have a cause of death and the number of registered deaths for a year. This is particularly the
case for deaths in 2022 (the most recent year) and younger individuals where there are significant discrepancies
between both these datasets.
-
To estimate the trends in death rates for different causes, we use Adjusted Deaths (Adj-deaths)
which refers to the deaths from a particular cause or range of causes adjusted by the ratio of registered deaths to deaths by all causes.
pease refer to the full report above, for more detailed information.
Disability Claims
For investigating the changes in disability claims, we use data from the Personal Independence Payment (PIP)
system of the Department of Work and Pensions (DWP). We analyse changes in PIP clearances for new claims
to the system, as explained in our previous analysis,
published on our website.
Summary/Abstract
In this study we investigate the UK trends in death rates and disabilities for diseases of the nervous system (neurological disease) for individuals aged 15 to 49 by computing excess death rates and excess disability claims, which are the difference between observed deaths/disability rates and a given baseline for expected death rates/disabilities. We measure changes in the behaviour of morbidity and mortality before the COVID-19 pandemic with the post-pandemic period, specifically for diseases of the nervous system.
We show a large increase in morbidity (disabilities) and mortality due diseases of the nervous system that started in 2021 and accelerated substantially in 2022. The increase in disability claims is consistent with the increase in excess deaths in 2022, and both are highly statistically significant (extreme events). The results indicate that from late 2021 a novel phenomenon leading to increased neurological disease deaths and disabilities appears to be present in individuals aged 15 to 49 in the UK.
Death and Disability Rates for Neurological Diseases for ages 15-49
In this study we investigate the UK trends in death rates and disabilities for neurological diseases (ICD10 range G00 -> G98) for individuals aged 15 to 49. We compute excess death rates and excess disability claims, which are the difference between observed deaths/disability rates and a given baseline for expected death/disability rates.
Adjusted Death Rates and Deaths from Neurological Diseases
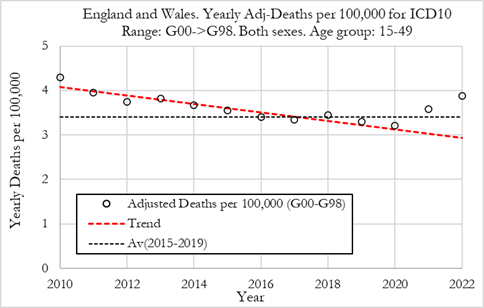
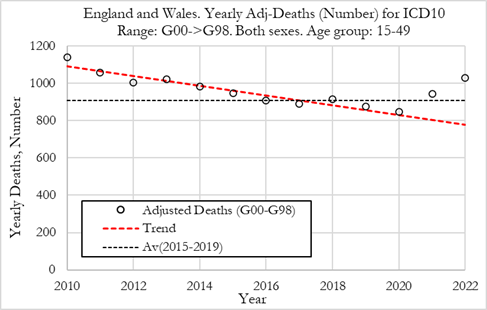
The Figures below show yearly adjusted deaths for neurological diseases (ICD10 codes: G00->G98) in England and Wales. The red dashed line shows the average from 2010 to 2019. The dotted line shows the 2015-2019 average death rate. Left: Adj-Deaths per 100,000. Right: Adj-Deaths (number).
Summary:
-
The death rate dropped in 2020 to about 3.2 per 100,000 and then rose to 3.6 per 100,000 in 2021. In 2022 the death rate increased again to about 3.9 per 100,000. The death rate in 2022 was about 0.2 deaths per 100,000 above the 2015-2019 average, and about 0.5 deaths above the rate predicted for 2022.
-
When translating these numbers into the absolute number of deaths from diseases of the nervous system, shown in the right figure, we can observe that the 5-year average deaths from 2015 to 2019 was 906 deaths. In 2020, neurological disease deaths were 848, a bit lower than the prior 5-year average. In 2021 there were about 943 deaths, which was about the same as the 2015-2019 average. In 2022, the number increased to 1,028, 122 more than the 2015-2019 average.
Disability PIP Clearances for new Claims from Neurological Diseases
The analysis we present here refers to clearances from new claims to the system. It should be noted that clearances refer to decisions made, which can be positive or negative. The fraction of positive clearances (that lead to a grant allowance) is shown to be stable over time at a rate of about 40%.
On our website, we present the analysis of trends in PIP clearances for the different body systems which include interactive charts where the user/researcher can change body system, age of the individuals and trend metric.
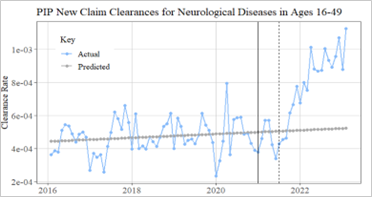
The figure shows monthly clearances for new claims to the Personal Independence Payment (PIP) system in the UK for the neurological system for ages 16 to 49. The vertical dotted line refers to June of 2021. The extrapolated 2016-2019 trendline is also shown.
Summary:
-
From 2016 to 2019 we observe that there was a modest upward trend in new PIP clearances per month for this group of conditions in this age group. During 2020, there was some increased variation month to month as pandemic measures were implemented (likely due to processing disruptions), but with no noticeable deviation from trend in new claims overall that year.
-
However, starting after mid-2021, we observe a systematic rise in the PIP clearances which continued until the last data point collected in January 2023.
-
PIP claims were examined separately by individual neurological condition to determine which diseases contributed most to the increase observed in overall neurological disease claims. Rates of the relatively non-specific categories of “Neuropathy” and “Other neurological disorders” were the top two conditions that saw the greatest increase after 2020 compared to pre-pandemic levels. More details within the full report
Analysis of Excess Death and Disability Rates for Neurological Diseases, for ages 15-49
In this section we investigate the trends in excess deaths from neurological diseases, with ICD10 codes ranging from G00 to G98, in England and Wales, for the 15-49 age group.
Analysis of Excess Adjusted Death Rates from Neurological Diseases
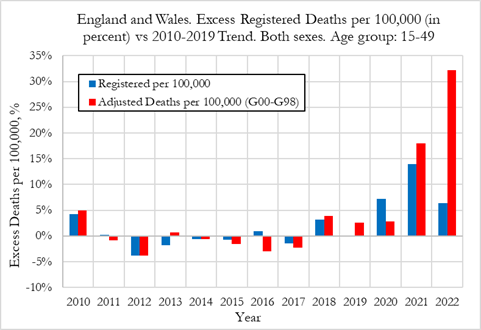
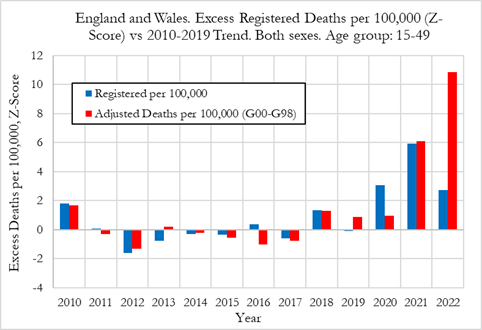
Our analysis shows (left figure) that the excess death rates from diseases of the nervous system were around 3% in 2020, rose by about 18% in 2021, and about 32% in 2022. On the other hand, the excess mortality for all registered deaths in this age group was about 7% in 2020, 14% in 2021, and 6% in 2022. The drop in excess mortality for all registered deaths from 2021 to 2022 was not mirrored in a drop in neurological disease deaths. The opposite occurred, with an acceleration in estimated excess deaths due to diseases of the nervous system. The excess mortality from neurological disease deaths in 2021 and 2022 are highly statistically significant with Z-scores of 6.1 and 10.9, respectively. These are very strong signals.
Summary:
-
Our analysis shows that the excess death rates from neurological diseases rose by about 3% in 2020, 18% in 2021, and about 32% in 2022.
-
The excess mortality from neurological deaths in 2021 and 2022 are highly statistically significant with Z-scores of 6.1 and 10.9, respectively.
Excess Disability PIP Clearances for new Claims from Neurological Diseases
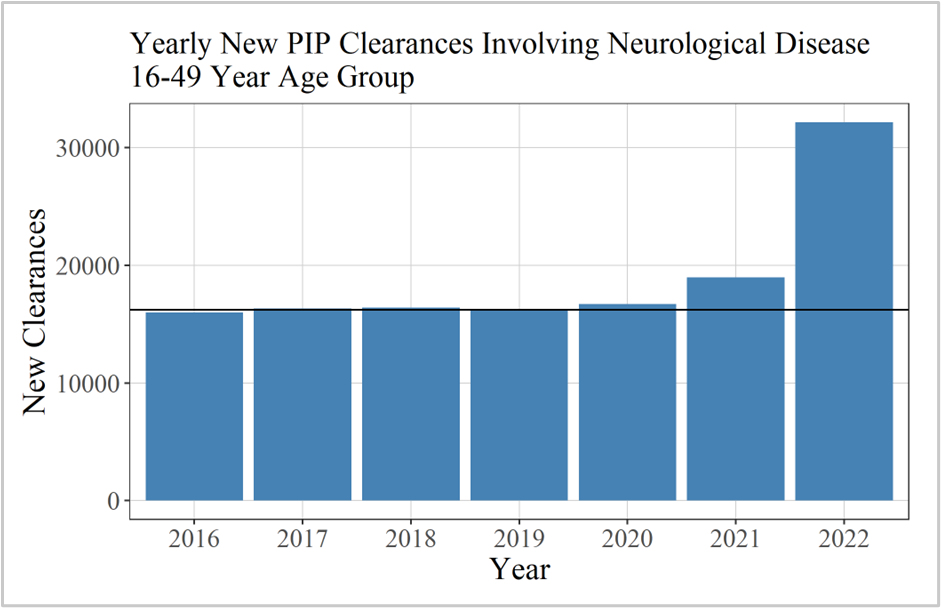
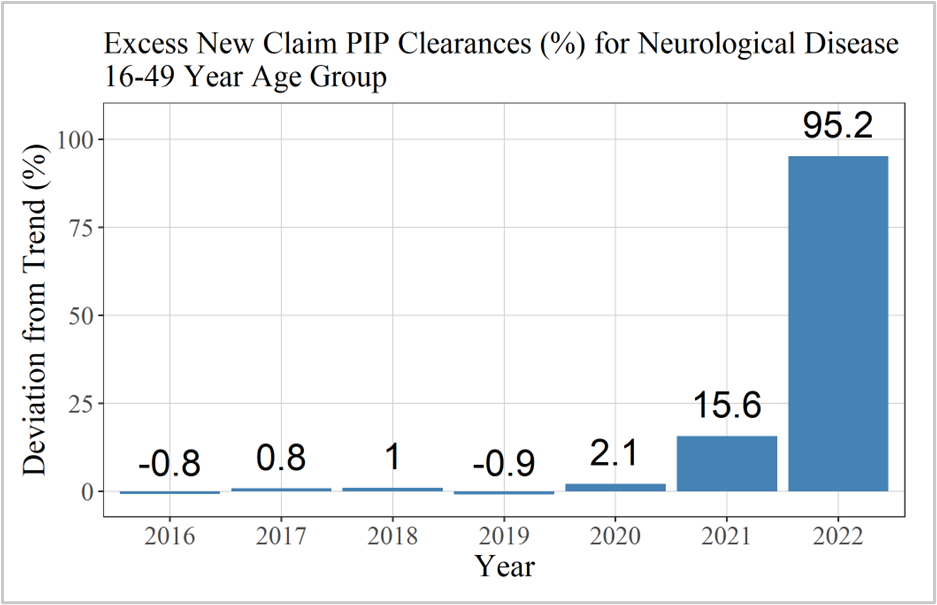
The figure below shows excess yearly clearances for new claims to the Personal Independence Payment (PIP) system in the UK for the neurological system for ages 16 to 49, relative to the 2016 to 2019 average number of new claims.
Summary:
-
When we compute the yearly PIP clearances from new claims due to neurological conditions, shown in figure (right), we observe that PIP clearances were very stable from 2016-2019, at around 16,211 per year. In 2021, there were about 19000 disability claims and more than 30000 in 2022.
-
In 2020 PIP claims increased by about 2.1%, which was a slight increase from the 2016-2019 trend. In 2021, PIP clearances further increased to 15.6% above trend and further still in 2022 to 95.2% above trend. We may recall that for excess deaths from neurological disease we observed positive deviations from trend of 3% in 2020, 18% in 2021, and 32% (estimated) in 2022 for those between 15 and 49.
-
We should also note that there was a backlog in PIP clearances peaking in August of 2021 which led to claims taking up to 26 weeks to clear. The DWP mentions that the situation was normalised from early 2022 with PIP claims clearing in about 14 weeks. Consequently, we must observe caution when directly comparing the timing of excess deaths with excess disability claims. However, on a yearly basis, these differences are smoothed out, as observed by the similarity of the trends in both excess deaths and excess disability claims for neurological causes.
Conclusions
-
The results shown in table above indicate that there was a significant rise in both disability claims and deaths from neurological diseases in the 15-49 age group in the UK.
-
In terms of disabilities from neurological diseases, in 2020 PIP claims increased by about 2.1%, which was a slight increase from the 2016-2019 trend. In 2021, PIP clearances further increased to 15.6% above trend and further still in 2022 to 95.2% above trend.
-
For excess deaths from neurological disease we observed positive deviations from trend of 3% in 2020, 18% in 2021, and 32% (estimated) in 2022 for those between 15 and 49.
Final Remarks:
-
The results suggest that there is an underlying phenomenon that is causing large rises in mortality and morbidity due to diseases of the nervous system. The explosion in neurological disease disabilities occurred from mid to late 2021 and accelerated in 2022, with a few months lag relative to the rollout of the COVID-19 vaccines.
A paper examining vaccine recipients totalling over 99 million showed a clear increase in risk of neurological conditions such as Guillain-Barre syndrome after vaccination, and a 1.5-fold increase in risk in the aforementioned condition after the first dose of the Astra-Zeneca vaccine, which was in widespread use in the United Kingdom (Faksova 2024). This particular vaccine was also associated with a 1.91 increased risk of transverse myelitis, and an alarming 2.23 increased risk of acute disseminated encephalomyelitis in this same study.
-
The observations above point to a worrying picture that we might see an even greater acceleration of neurological deaths and disabilities in the coming years, which makes the investigation of the underlying causes of upmost importance.
-
Future research should be aimed at disentangling the effects on each separately or in combination, stratified by age group, to better inform public health decisions in the future and lead the direction toward effective therapeutic strategies for related conditions.


